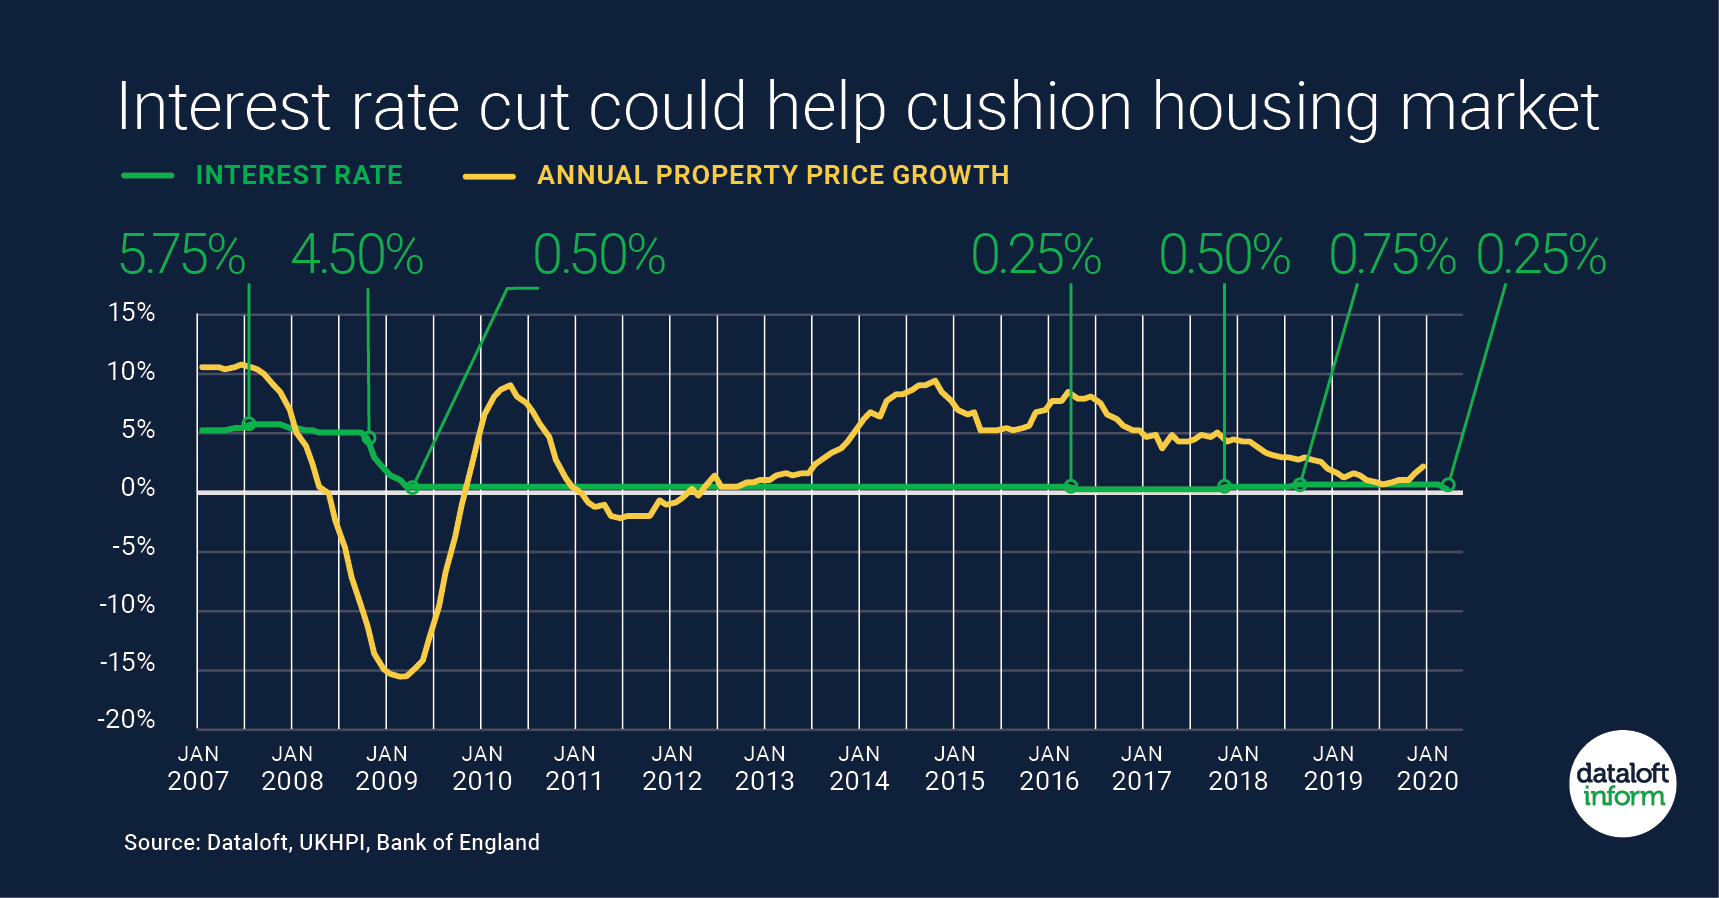
This chart takes a look at how sales levels have evolved over the last eight months in the local area. It should be noted that we’re looking at a relatively tight area over short periods of time, which is why there is a lot of volatility in the figures. The patterns however, are very revealing and show how seasonality affects the dynamics of the market.


