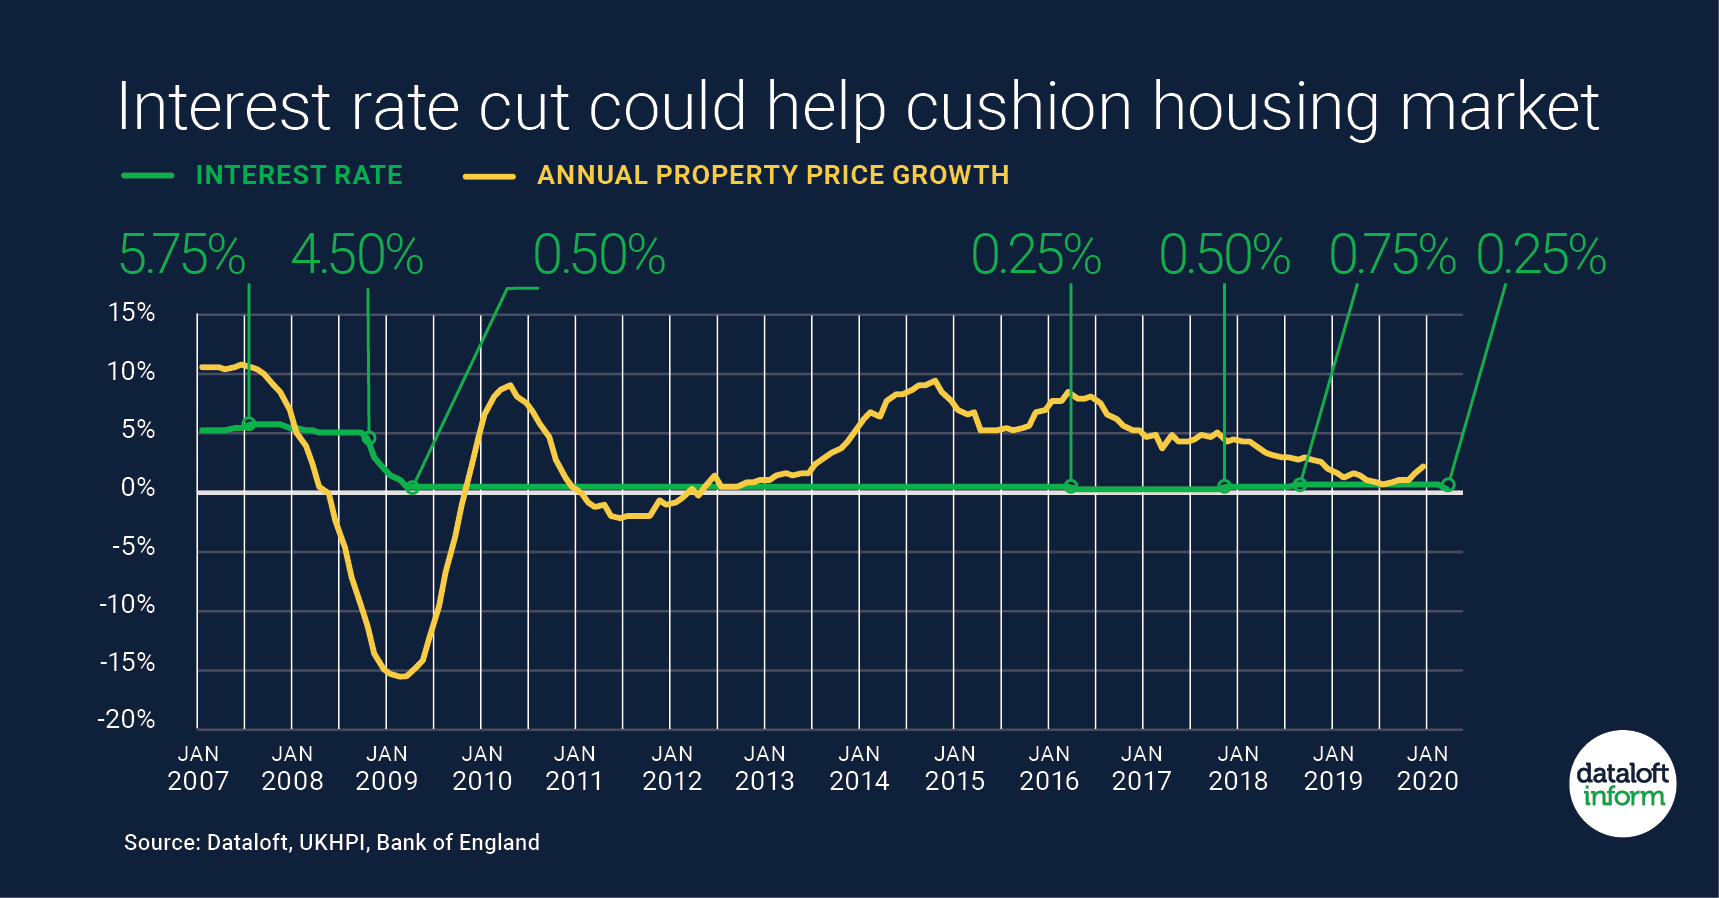
- Brexit continues to make long-term and strategic decisions difficult for UK-based businesses and homeowners. Yet both the UK economy and its housing market registered around 3% annual growth in each of the first three quarters of 2018.
- Since the last troughs in GVA* in Quarter 4 2009 (Q409) and house prices (Q109), both indicators have risen a similar magnitude of 36% and 42% respectively. The relationship between the two indicators, using annual % change on a quarterly basis, suggests a correlation of some form does exist, with changes in house prices lagging by approximately three months.
- GVA recorded a slight uptick in annual change in Q318 (4%) yet Gross Domestic Product (another measure of economic performance) indicated that the economy was starting to slow.
- The consensus of economic forecasters (OBR, IMF, NIES and OE**) for total GDP growth in 2019 to 2022 is however positive at 7.2%, with 1.8% expected to be confirmed for 2018. Ernst and Young’s Regional and City Forecasts for GVA predict that London and the South East will continue to outperform in terms of annual GVA growth until at least 2020.
- *One widely used indicator of overall economic performance is ‘Gross Value Added (GVA)’. It measures the increase in the value of the economy due to the production of goods and services. ** Office for Budget Responsibility, International Monetary Fund, National Institute of Economic and Social Science, Oxford Economics.
If you are curious about the value of your property, please do get in touch on 0161 434 4311 and we can arrange a valuation.


